

Re-Introduction
In Part 1 of this blog post, we discussed the importance of biodiversity in driving our process of discovering new and innovative functional protein ingredients at Shiru. We then explored how protein diversity, as measured by protein richness, expands as one progresses through corn and sunchoke taxonomic hierarchies. Protein richness across taxonomic rank also revealed a bias in protein data availability towards plants of human interest, such as crops. The protein diversity and bias in protein data can be visually summarized in Figure 1.
Figure 1 – Protein and species counts in Corn and Sunchoke Taxonomic Hierarchies
Multiple Dimensions of Protein Diversity
Our thus far applied metric of diversity, of only considering species richness, has limitations. It fails to take into account similarity between proteins, such as proteins that are structurally similar and/or that perform similar functions. One approach for a high resolution assessment of protein similarity, and one among a collection of similarity searches applied at Shiru, is the calculation of pairwise sequence identity. Another approach is to leverage protein ontologies. Proteins are sorted into various ontological frameworks based on shared characteristics. One such framework is PFAM, a means of identifying domains and using combinations of domains to assign proteins to families based on sequence similarity (as determined by hidden Markov models and multiple sequence alignments). Another framework for organizing protein relatedness is the organization of the genes from which the proteins are translated. Gene Ontology or GO annotations can be used to sort proteins, via their precursor genes, based on three dimensions – the functions of the proteins, the locations in a cell that the proteins occupy, and the biochemical pathways within which the proteins play a role.
By scaling our counts of protein richness by the number of unique PFAMs or GO terms associated with those groups of proteins, we introduce an additional layer of complexity that can further our understanding of protein distributions across taxa. If we use these (log-transformed) ratios of proteins to unique PFAMs or GO terms to scale the size of our points in Figure 1, we get Figures 2, respectively. Both figures similarly display the general trend that lower taxonomic ranks (identifiable by their lower species counts) tend to have more unique PFAMs or GO terms per sequence. This suggests that as more species are aggregated, there is more redundancy (in domain composition and in function) in the aggregate pool of proteins. Scaling protein richness as a ratio with unique PFAMs or GO terms also reveals that while our data comprises far more corn proteins than sunchoke proteins, our sunchoke proteins are relatively more diverse. This generalizes up the taxonomic hierarchies – when comparable ranks (as judged by species count) are considered, corn taxonomic ranks have more associated proteins, while sunchoke taxa possess larger ratios of relative protein diversity.

Figure 2 – Protein and species counts in Corn and Sunchoke Taxonomic Hierarchies, scaled by the log ratio of unique PFAMS to proteins
Utility of Differing Aspects of Protein Diversity
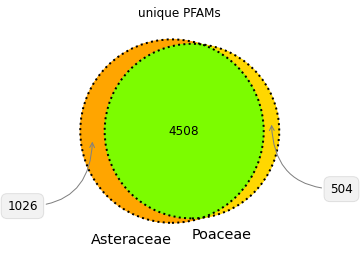
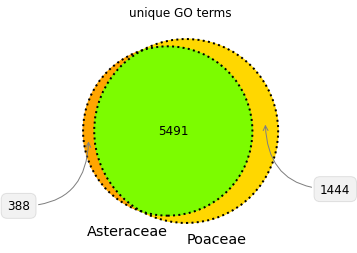
Corn and sunchoke provide contrasting examples of protein richness and protein functional and structural diversity. Corn has more protein sequences available for study, while the sunchoke proteins available are relatively more diverse. At Shiru, all sequences have value in playing differing roles in our discovery process, and driving divergent avenues of discovery. Understudied organisms will have less protein sequence data available, but those sequences that are available will likely be more diverse (when compared amongst themselves), and so offer more potential for high-novelty discoveries. Over-studied organisms will have more protein sequence data available, with high redundancy in protein domain patterns and functions. This redundancy can allow for opportunities to study the nuance of slight changes in sequence, and how those changes impact function. Furthermore, while plants share many common structural features that are composed of proteins from the same protein families, a comparison of protein families and functions in Poaceae and Asteraceae illustrates that differing taxa have evolved individual strategies for success and survival, necessitating functionally divergent subsets of their proteomes (Fig. 4, Fig. 5). So whether a taxonomic group is understudied or overstudied, there is value in its inclusion, as biodiversity as assessed via taxonomy is reflective of diverse adaptations, niches, habits, and lifeways, which all operate on differing foundations of proteins.
Note on species counts
The species counts per taxonomic rank used in this blog post were determined via NCBI Taxonomy data.